Gantt charts have proven helpful for project managers looking to properly organize and monitor their projects. These charts are a cornerstone of current project management practices because they help project planning by visually depicting the project’s timeframe, activities, and interdependencies.
1 Minute Breakdown
A Gantt chart is a project management tool that displays a project’s schedule, activities, and dependencies. It was invented by Henry Gantt in the early 1900s and is now a widely used tool in project management. The chart typically shows the project chronology horizontally, with each task represented by a horizontal bar along the timeline, indicating the task’s duration and start/end dates.
Gantt charts help project managers plan, allocate resources, track progress, and communicate project status to stakeholders. They enable project managers to identify the critical path of a project, ensure on-time project completion, and allocate resources efficiently. Gantt charts also improve communication among team members, management, and clients. By providing a comprehensive overview of the project timeline, project managers can track progress, identify potential risks, and distribute resources efficiently.
Table of contents:
- What is a Gantt chart
- Pros of using Gantt charts
- Gantt chart components
- Software for creating Gantt charts
What is a Gantt chart?
A Gantt chart is a popular project management tool that clearly represents a project’s schedule, activities, and dependencies. Henry Gantt invented the chart in the early 1900s, and it has since become an essential component of project management approaches.
The chart usually displays the project chronology horizontally, with each task represented by a horizontal bar along the timeline. The length of the bar represents the time of each task, while the bar’s position represents the task’s start and end dates.
Gant charts enable project managers to determine the critical path—the sequence of tasks that must be done on time for the project to be completed on time. Furthermore, Gantt charts can be used to allocate resources, track progress, and communicate project status to stakeholders.
Overall, Gantt charts provide project managers with a reliable and easy-to-use tool for monitoring, planning, and controlling project schedules, ensuring that projects are completed effectively, efficiently, and, most importantly – on time.
Pros of using Gantt charts in project management
Using Gantt charts offers a large number of advantages. In the following paragraphs we’ll detail some of the most important pros of using these kinds of charts:
Better project planning
Gantt charts can significantly improve project management planning by offering a clear and ordered overview of project tasks and dates. Project managers can better allocate resources, discover dependencies between activities, and set realistic deadlines by breaking down a project into smaller, manageable tasks.
Gantt charts also make it easy for project managers to see how each activity fits into the broader project timeframe. Using Gantt charts allows project managers to spot possible bottlenecks and alter the project plan accordingly, preventing delays and keeping the project on schedule.
Better progress tracking
Tracking progress is one of the primary benefits of utilizing Gantt charts in project management. Gantt charts provide a comprehensive project timeline perspective, allowing project managers to track progress and detect any potential delays or concerns.
Project managers may verify that the project is on track and that activities are performed within the timeframe specified by tracking progress. This avoids delays and guarantees the project is completed on time and under budget.
Gantt charts also enable project managers to identify key tasks that must be performed on time to keep the project on track. Project managers can assign resources and prioritize tasks to ensure the project stays on track by identifying essential tasks.
Improved communication
Gantt charts provide project stakeholders with various benefits, including improved communication. They give a clear and visually appealing representation of project deadlines, tasks, and dependencies, allowing team members, management, and clients to share project status and progress.
By publishing Gantt charts, stakeholders can be updated on project milestones, timeframes, and task progress. This promotes confidence and credibility by allowing stakeholders to monitor progress and obtain a better knowledge of the project. For example, if a task is delayed, stakeholders might work together to devise a strategy to get the project back on schedule.
Better risk management
Another benefit of using Gantt charts in project management is their ability to identify and manage risks. Gantt charts can assist project managers in identifying potential hazards and taking steps to mitigate them by providing a visual picture of the project schedule.
For example, suppose one work depends on another at great danger of being delayed. In that case, project managers can detect this potential risk and devise contingency measures to address it.
Gantt charts can also indicate potential resource constraints, such as when a resource is in high demand or unavailable during a specific period.
Efficient resource distribution
Gantt charts are excellent for distributing resources efficiently. Project managers can determine when resources are needed and assign them accordingly by providing a comprehensive overview of the project timeline.
For example, if a specific task necessitates the participation of a team of specialists, project managers can allocate the necessary resources and ensure that the team is ready when needed. Doing this helps to reduce delays and keeps the project on pace.
Gantt charts are also helpful for identifying potential resource conflicts, such as when two jobs use the same resource simultaneously. By anticipating these conflicts, project managers can take steps to address them and guarantee that resources are available when they are required.
What are the components of a Gantt chart?
Usually, the components of Gantt Charts are the following:
- Task list: A list of all the tasks that must be completed to complete the project, usually in the order of importance.
- A horizontal axis that depicts the project’s timeline.
- Task bars: Horizontal bars that indicate each project task. Each bar’s length correlates to the task’s duration, and its location suggests the task’s start and end dates.
- Dependencies: Arrows or lines connecting related tasks to demonstrate their interdependence.
The components of a Gantt chart collaborate to give a clear and comprehensive visual representation of the project timetable, tasks, dependencies, and resource allocation, allowing project managers to track progress and ensure that the project stays on track.
What are the most used types of software for creating Gantt Charts?
Some of the most popular programs that let you create Gantt Charts are:
- Microsoft Project: Comprehensive project management software with Gantt chart capabilities.
- Trello is a simple project management application with an integrated Gantt chart.
- Asana: A project management tool with a Gantt chart for visualizing project timeframes.
- Smartsheet: A cloud-based project management application that includes Gantt chart features.
- TeamGantt: a web-based project management solution for producing and sharing Gantt charts.
How to create a simple Gantt chart using Google Spreadsheets
While it not be the most ideal software, you can easily create a Gantt chart using Google Spreadsheet.
Open a new Google Spreadsheet.
Add your data: you will need to enter task names, start dates and finish dates.
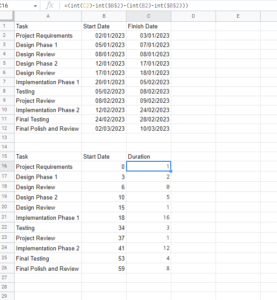
Apart from adding the data above, in order to make a Gantt chart in Google Spreadsheets, you’ll need to calculate the duration of each task. This can be done manually or using formulas, in the spreadsheet (check the above image to see the formula I used). Also, you can check all the formulas in the spreadsheet, that can be viewed by anyone.
Select your data (the second table in the spreadsheet), then insert a chart, it should look something like this:
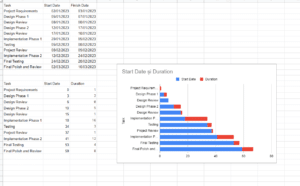
In order to transform this chart into a Gantt chart, we’ll just need to change the color of the Start Date bars, to do this, double click on them on the chart, and change their color to none. You can also set the color to white, and put the opacity to 0.
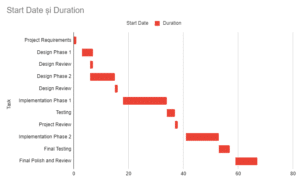
The result should be similar to the one in the image above. This is one of the simplest ways to create a Gantt chart.
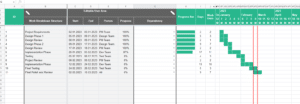
Another way of creating Gantt charts in Google Spreadsheets is to use an extension, for this example I used the Gantt Chart Project Management Extension.
To do this, add the Gant Chart Project Management extension to your spreadsheet. A new sheet will open where you can manually add your data, and you’ll find your Gant chart in the right side, just like in the image below:
How to create a Gantt chart using Trello and TeamGantt:
You can create simple or complex Gantt charts using Trello and the TeamGantt Power-up.
However, you’ll need a Trello account, and a TeamGantt account.
After signing-up for TeamGantt, you can add the TeamGantt Power-up to your Trello board.

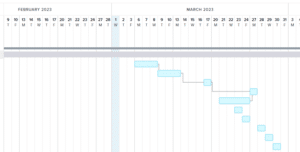
After clicking view in TeamGantt, your Trello board will open as a Gantt chart. In this new tab, you can view all the tasks that are available on your Trello board, and do a lot of customizations like creating dependencies between them, setting the duration of the tasks and assigning people to them. More detailed information about how to create a Gantt chart using Trello and TeamGantt can be found here.
Your success story begins with our tailored solutions!
Our team specializes in crafting tailored solutions to meet your unique challenges and goals, providing you with the expertise you need to succeed.